*Cue music*
… da da da dum dum…
*Serious reporting voice*… Good morning and welcome to The Shroom’s annual weather report for the period of Winter 2013-2014.
Since the establishment of a mechanical weather monitoring system at The Shroom’s vegetable garden premises; several observations of extreme weather have been made and empirical data collected of these events with regards to precipitation (mm), temperature (oC) and humidity (% r.h.).
 |
| Mechanical weather station |
The results were as follows:
 |
| Temperature and Humidity for Roodepoort 2013/14 |
 |
| Temperature for Roodepoort 2013/14 |
 |
| Humidity for Roodepoort 2013/14 |
 |
| Rainfall for Roodepoort 2013/14 |
*Ahem*
On a less serious note; I have been monitoring our weather patterns since Winter (~July) of 2013 with bare basic equipment – lately I have seen more sophisticated home-weather monitoring systems of the digital kind that even links to your computer and can make predictions! I would love to get my hands on one of those, but alas the garden budget does not support such endeavours…
 |
| Personal home weather station |
Highveld/Johannesburg
Area ‘Official or Expected’ Seasonality
Season
|
Timeframe
|
Expected weather
patterns
|
Spring
|
August to Mid-September
|
Strong and cold southerly winds during August and frost
expected till mid-September. First day of spring is 1 Sep and first showers
are usually expected in September as well.
|
Summer
|
Mid-October to Mid-February
|
Dry and hot with rainfall from Sep/Oct to April. Maximum
daytime temperatures 26oC during January. Average rainfall 713 mm
per annum, mostly during the summer months and occur as brief afternoon thunderstorms.
Hail storms can occur from October to December.
|
Autumn
|
Mid-February to April
|
Hot weather prominent till end March when cold fronts
start to chill the Highveld.
|
Winter
|
May to July
|
Dry and crisp with little/no rainfall, occasional shower can
occur but usually with less than 1 mm of rain during a shower. Minimum
daytime temperatures 16oC during June. Night temperatures can drop below
freezing causing frost. Snow rare.
|
Alright so the table summarised the average of what is expected for the Johannesburg area, but my vegetable garden is in Roodepoort and we have a prominent hill that dictates locate weather patterns. Here is an overview of Roodepoort and that hill (of which I don't know the formal name, so let's make it Roodepoort Hill)...
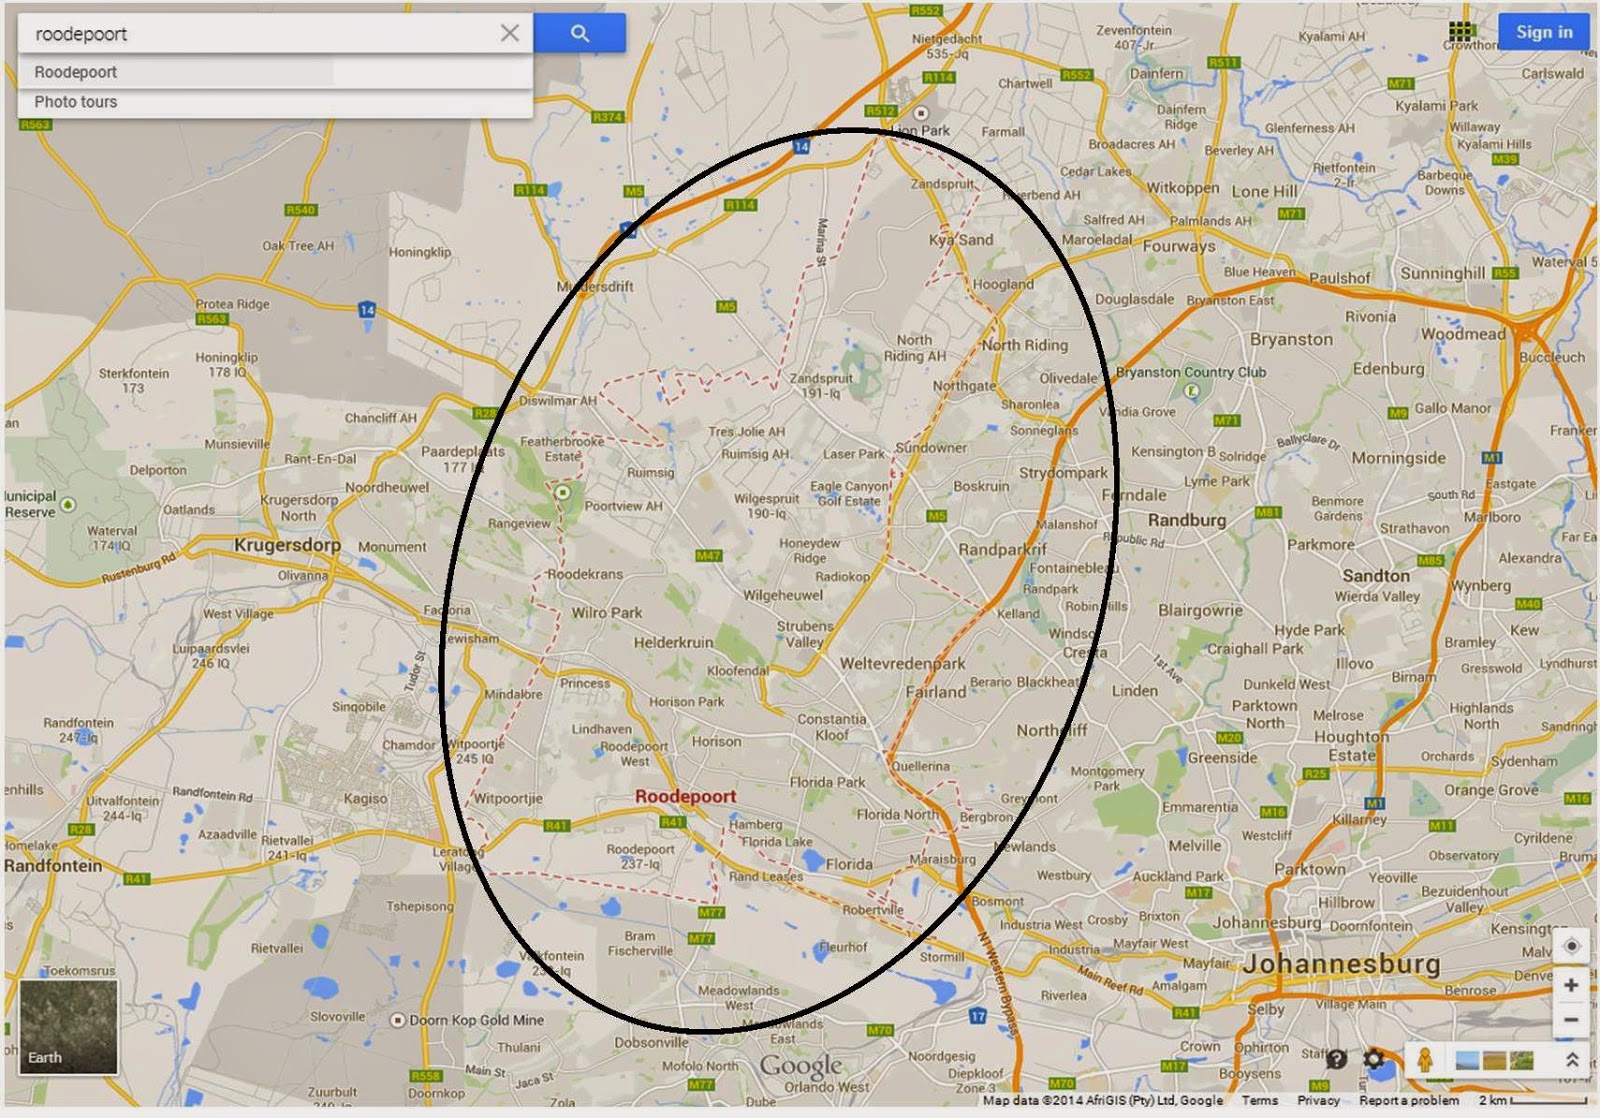 |
| Roodepoort Streetview Google map |
 |
| Roodepoort topology Google map Orange: Roodepoort Hill Green: Water Sisulu National Botanical Gardens |
Now, I don’t think that our Roodepoort Hill is large or high enough to cast a “rain shadow” on either side, but our rainfall patterns (time and amount) differs from Johannesburg and Pretoria. I mean rainfall even differs within Roodepoort itself. For instance, I have some rainfall data courtesy of a local golf estate not far from us and we have hugely different rainfall and temperature patterns! Let me summarise my observations similar to the previous table:
Highveld/Roodepoort Area Observed Seasonality
Season
|
Timeframe
|
Observed weather
patterns
|
Spring
|
September to Late-October
|
I documented the last cold front in late Sep, hence the
shift in seasonality, and there were some nasty cold August winds that did quite a bit
of damage to early budding fruit trees. Maximum daytime temperatures only
exceeded 20oC since Oct. First rains (above 5 mm event) arrived
Mid-Oct.
|
Summer
|
Late-October to Mid-March
|
With the first rains came hail-storms, especially during
Oct/Nov. On average <10 mm of rain fell during a rainfall event and more
often a rain event would be 5-6 mm from Oct-Dec. From Jan-Mar rainfall occurred
more often (average <15 mm) and 8-10 mm events would occur more often. The
average maximum daytime temperature was 24oC, but several days
reached 30oC during Nov-Jan. Average rainfall was 877.5 mm for the
year, which is higher than average, but rain occurred mostly at night.
|
Autumn
|
Mid-March to Mid-May
|
March was still very hot and the average daytime temperatures
only fell below 25oC during mid-march. Daytime temperatures
remained around 20oC for most of Autumn.
|
Winter
|
Mid-May to August
|
Average daytime temperature was 16oC with the
coldest days from June to August. Some very windy days did some damaged
to plants in the garden. Two showers occurred, but the rain was so marginal
it could not be measured. Light to severe frosts occurred during August and
September.
|
Final Remarks: Extreme weather dominated summer and we had several events when I was certain that the vegetable garden had its last day, these were:
1) Three hail-storms were recorded, two had 1 cm hail stones and the last had 4-7 cm hail stones!!
I was convinced that the veg garden was flattened but thankfully we only had a few casualties.
 |
| Hailstorm, summer 2012-2013 Nasty serrated hail! |
 |
| Hailstorm, summer 2013-2014 Hail stone in the picture on bottom right is one of those 7 cm ones! |
2) Floods had occurred during January and February because of 100 mm rain falling within 24 hours, that is 10x more than our average rain event! You can see it on my rainfall graph as two huge spikes!
So much rain fell that several herbs had to be emergency evacuated into the house due to threat of dying! The Walter Sisulu National Botanical Garden not far from our home reported that flood waters had caused damage and resulted in a monster waterfall there!
 |
| Rain refugees |
 |
| Waterfall at Water Sisulu NBG on the (left) during floods and on the (right) full, but normal size |
For more info and videos on the flood and waterfall of Walter Sisulu NBG check out:
Other observations:
1) Some interesting correlations was that it was more likely to rain when the measured humidity exceeded 60% and that I would not have to water the garden for a day only after 10 mm of rain had fell.
2) No bees are seen at the basil when rain is imminent.
3) Hailstorm clouds are big, black, high off the ground and scary. They mostly come from a South-Western direction, whereas thunderstorms are dark grey and big, but not so high off the ground. Yet they bring rain down with such a force that sometimes leads to damage.
4) A shift in maximum daytime temperatures. I measured weekly daytime temperatures during 11h00-13h00, as this is our 'official' maximum temperature during the day, but this has shifted to 15h00-17h00. Although, my average daytime maximum is at 24oC on my graphs, we regularly had temperatures of 29-31oC in the late afternoon!
4) A shift in maximum daytime temperatures. I measured weekly daytime temperatures during 11h00-13h00, as this is our 'official' maximum temperature during the day, but this has shifted to 15h00-17h00. Although, my average daytime maximum is at 24oC on my graphs, we regularly had temperatures of 29-31oC in the late afternoon!
 |
Just a quick note on frost dates for Roodepoort, but I imagine it would be similar for the rest of the highveld (Johannesburg, Pretoria and Gauteng). The first date of expected occasional frost is 3 May, whereas the first expected date of regular frost is 30 May. Thereafter the last date of expected regular frost is 25 August, but the last expected date of occasional frost extends until end September (30 Sep).
I have expanded my weather observations to forecasting by using the shape and colour of clouds (still trying to get the hang of it, will do a full post of weather forecasting using clouds at a later stage!) and I am also recording all the activity in the garden in terms of wildlife as well – be on the lookout of a Nature Watch post later in the year!
I have expanded my weather observations to forecasting by using the shape and colour of clouds (still trying to get the hang of it, will do a full post of weather forecasting using clouds at a later stage!) and I am also recording all the activity in the garden in terms of wildlife as well – be on the lookout of a Nature Watch post later in the year!
That concludes our crazy weather for 2013/14, stay tuned for another update next year!
*Serious reporting voice*
…Keep well and good night…
______________________________________________________________________________
Please share with fellow gardening enthusiasts via the various sharing buttons at the end of posts/pages! Else you can vote for posts through the Google reactions bar at the end of articles. To stay up to date I have provided several reader and social networking platforms with which to subscribe: Twitter, Pinterest, RSS Feed Reader or Email/Follow directly using the Blog Followers widget on the left hand side toolbar. Thank you for reading and please feel free to ask if questions arise - I appreciate comments and ideas too! 😆
_________________________________________________________________________________